
Visual Clarity for Complex Cases
Exhibits, animations, and data visuals for every stage of litigation.
-

Animations
Motion graphics that show mechanics, emotion, and change over time
-

Illustrations
Precise still images that are quick and low-cost to produce
-
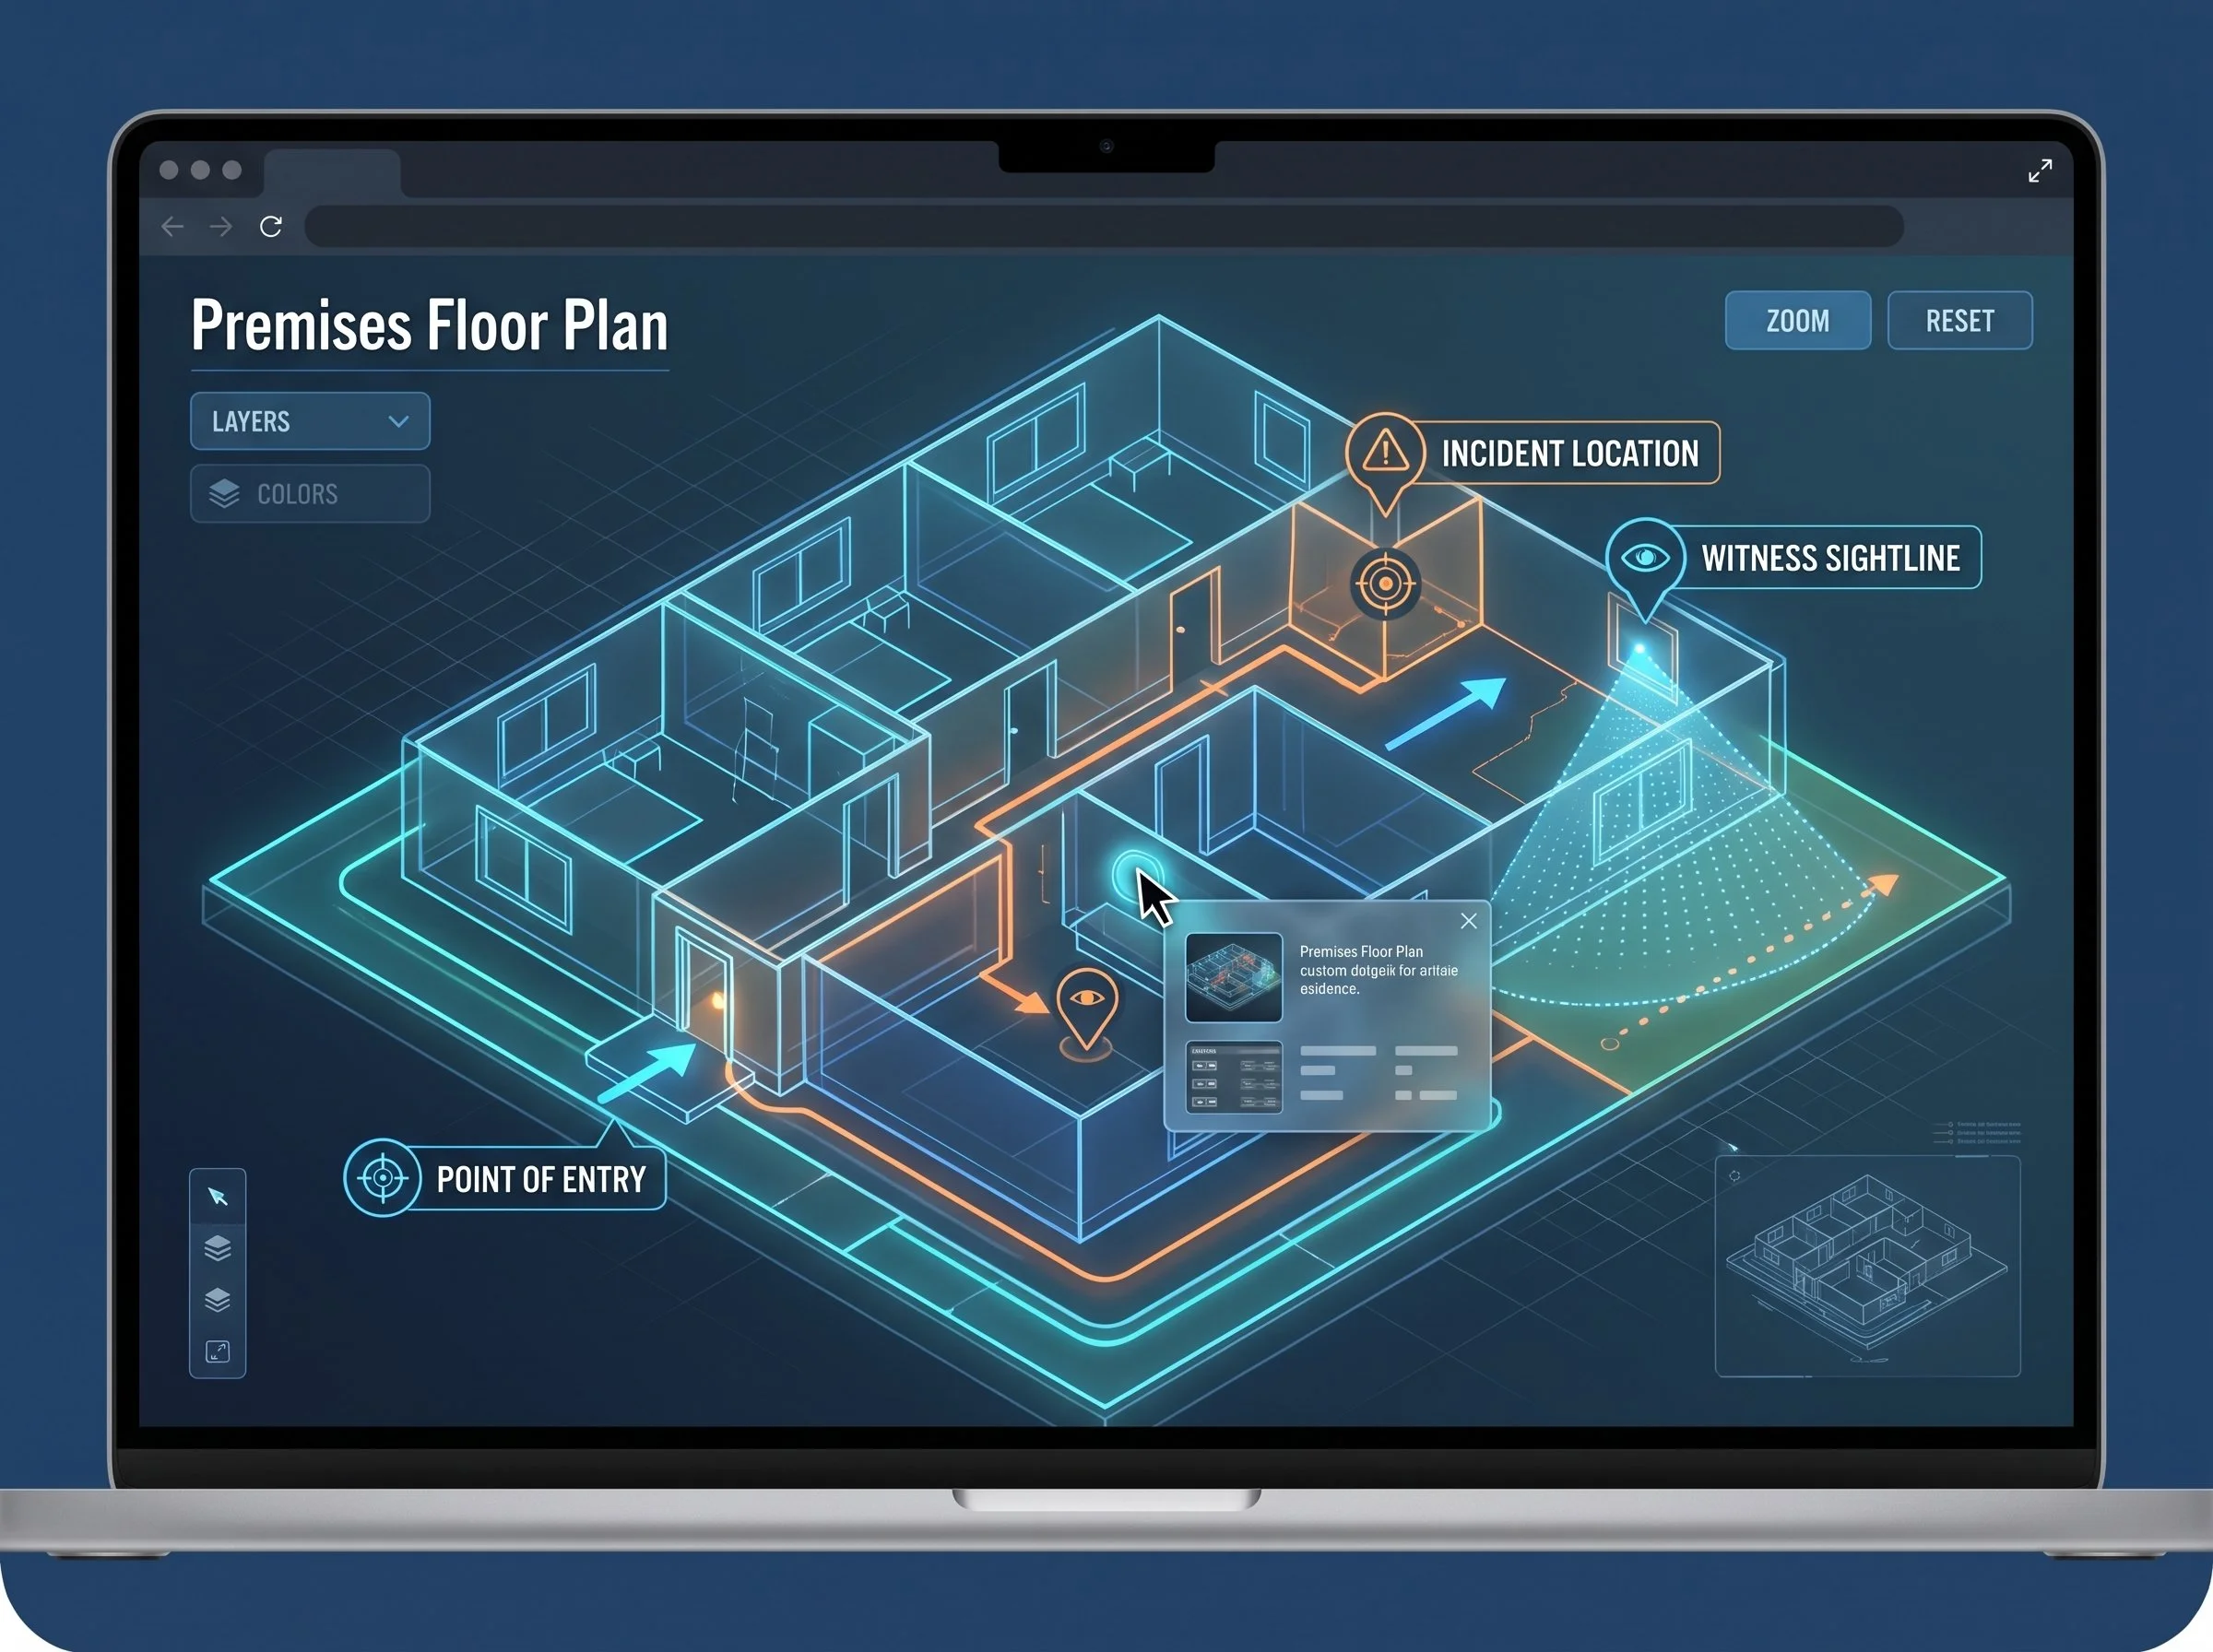
Interactive Exhibits
Clickable timelines, maps, and diagrams you control live in court
-

Data Visualizations
Charts and dashboards that make data heavy evidence easy to follow
-

Visual Strategy Consulting
Expert guidance on the facts laypeople find most compelling, and the visuals with the most impact
Build your visuals strategy in two minutes.
Answer four quick questions about your case. Get recommended visuals and a development timeline built around your deadline.
Try the Case Visuals Planner →Case Types
We work with your experts, for plaintiffs or defendants, to create accurate, defensible visuals for every kind of complex case.

-
Illustrating complex fact patterns, timelines, and events in commercial, securities, intellectual property, data security, and other business litigation to help the judge and jury better visualize the key facts.
-
Simulating vehicle dynamics, crash vectors, and occupant biomechanics using precise data to demonstrate the exact mechanism of injury.
-
Illustrating slip-and-falls, construction site failures, and structural hazards to establish clear liability and structural negligence.
-
Deconstructing defective machinery, failed consumer products, or medical device malfunctions to visually prove design or manufacturing flaws.
-
Developing sensitive yet impactful narratives that clearly illustrate fatal trauma or progressive systemic failure caused by negligence.
-
Recreating complex surgeries, misdiagnoses, and surgical errors with exact anatomical accuracy to prove deviations from standard care.

Clarity Is Persuasive
Founded by legal, business, and medical experts, our team understands the ins and outs of hearings and trials, including high-stakes and bet-the-company litigation. We leverage automation tools to speed up production and pass the cost savings to you.
From Case Documents to Court-Ready Visuals
Click each step to see what happens. For motions, mediation, arbitration, and trial.
Define Key Visuals & Case Strategy
We analyze your case documents alongside your expert witnesses to set clear visual objectives designed to be court-admissible.
- Direct collaboration with lead attorneys and expert witnesses
- Review of documents, data, imaging, and physical evidence
- Admissibility strategy and scope outline
Detail & Storyboard
We map out key-event timelines, scene-by-scene views, focus areas, and sequences. Storyboards give your team complete control over the narrative before production begins.
- Keyframe drafts and layout proposals
- Technical accuracy check with your experts
- Timeline alignment with the case narrative
Draft & Render
Using state-of-the-art software and AI-assisted workflows, we build high-definition, accurate visuals with fast turnaround.
- High-resolution 3D, interactive, and data graphics
- Clear cause-and-effect indicators
- Automated production pipelines that keep costs low
Finalize & Deliver
We incorporate your team's final feedback and deliver files optimized for trial presentation software, briefs, and mediation packages.
- 16:9 1080p video, browser-based interactive packages, or high-res images
- Formatted for motions, mediation, arbitration, or trial
- Fast turnaround on final minor revisions
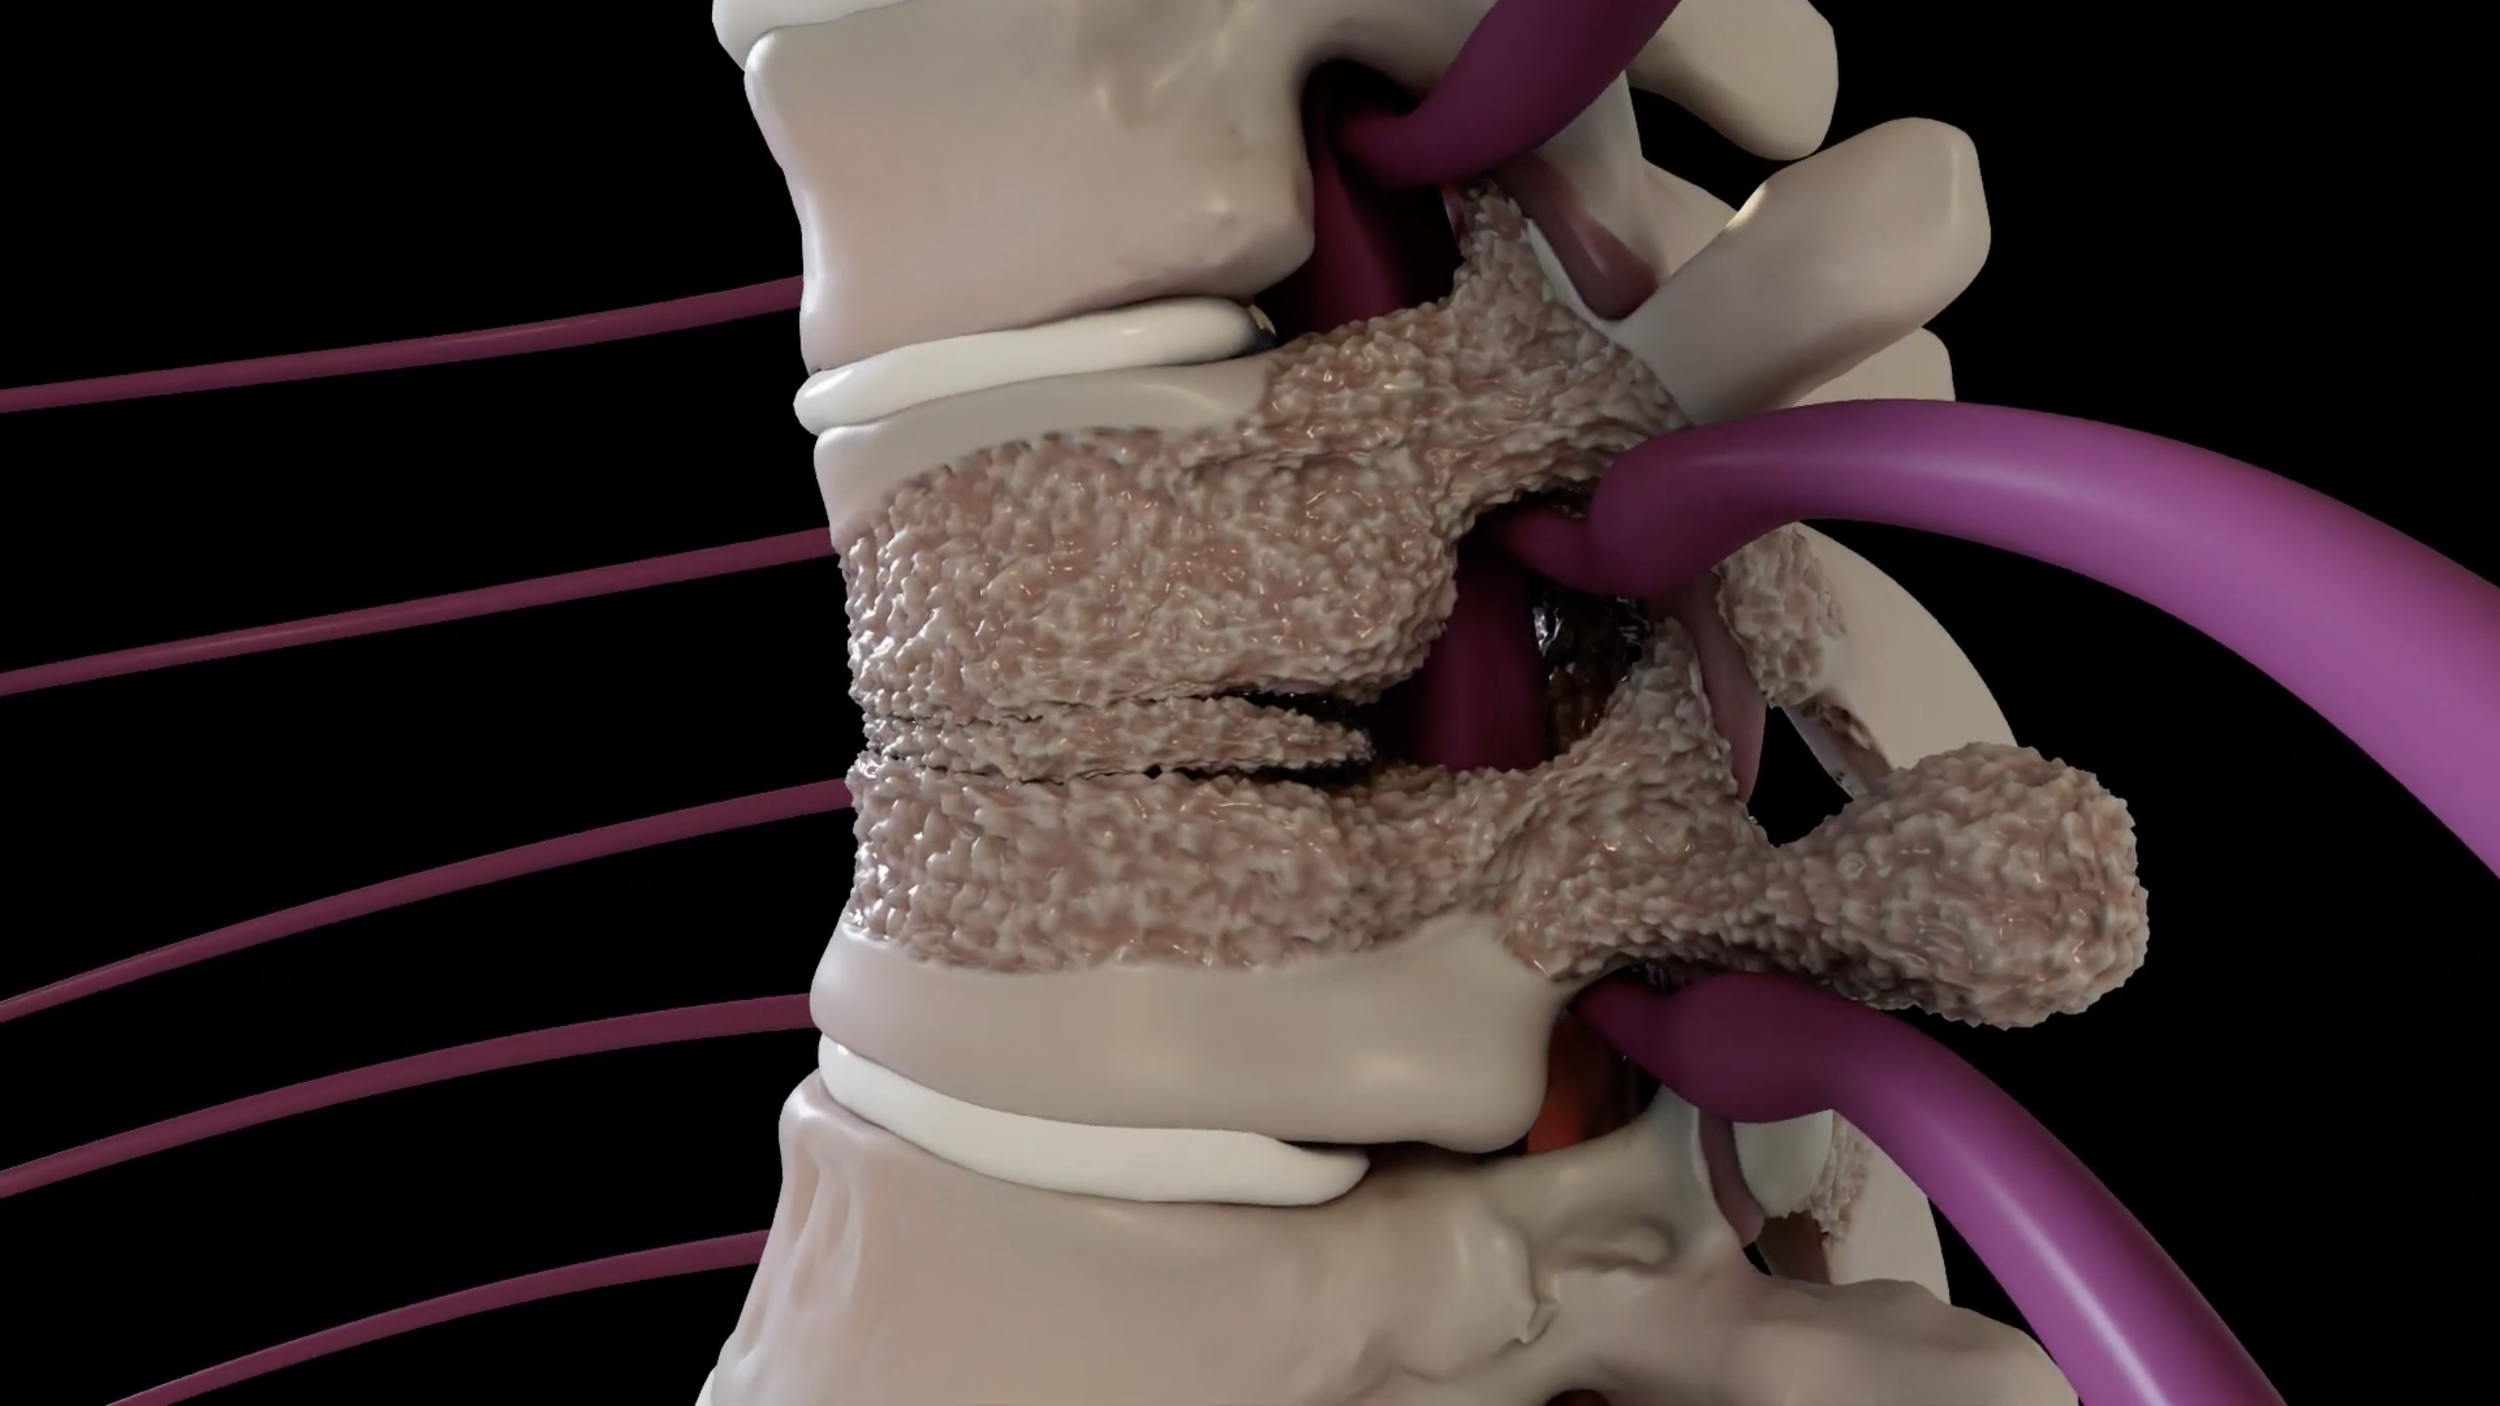
Case Study: Spinal Epidural Abscess
This case study highlights how a high-fidelity 3D animation was used to visualize the rapid progression of a spinal epidural abscess and the catastrophic mechanical compression it exerted on the spinal cord.
By translating complex MRI data into a clear, chronological narrative, the animation demonstrated the critical window for surgical intervention and the anatomical consequences of delayed treatment.
This visual evidence was instrumental in bridging the gap between technical medical testimony and jury comprehension, effectively illustrating the physical reality of the plaintiff's neurological injury.